![]()
Geo Tunnel module gives you total control over the tunnel. With a tunnel model and extensive volume calculation, unlimited possibilities are given for accounting and control of tunnels in all forms.
The design of theoretical tunnels is done easily with graphic and numerical aids. Any number of theoretical tunnel sections are connected with or without interpolation. Together with a road line and a profile, a complete description of the tunnel is formed in three dimensions.
Volume calculation can be done against a theoretical tunnel with optional offset, and is limited in side and height. A volume report, together with the extensive drawing functions, provides a detailed account and control of the tunnel.
A measured tunnel can be directly compared with a theoretical tunnel, with an account of the section, side dimensions and distance from the theoretical tunnel, for quick control of critical sections. It is possible to calculate different models and report at the same time as different layers.
Measurement of tunnels is most conveniently done with the field computer GeoPad and Leica or Trimble / Geodimeter servo instruments with prismless distance measurement.
In GeoPad you can control the tunnel measurement in all dimensions. Any interval between measured sections and any interval along the section can be specified. In addition, you decide which part of the tunnel, lengthwise, heightwise and sideways, is to be measured. There are also functions for loading and managing data from tunnel scanning.
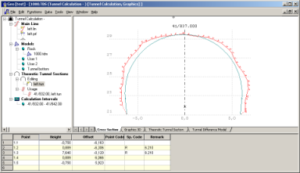
The tunnel management in Geo is built around the tunnel description file, tbs. It contains all the components needed for the tunnel, e.g. center line, profile, model data and theoretical tunnel shape. The tunnel description also states all connections between the components. The tunnel description file is edited in a window that is divided into a number of views:
All components and connections included in the tunnel description are shown here. The entire tunnel calculation is administered via the tree and it provides support for composing the tunnel description. By clicking in the tree, you activate the entry and editing of details in the description. You can also choose what is to be displayed in the graphic window.
By clicking in the graphic view, you get access to the graphic tools and can edit data in the same way as in a normal graphic view.
All the files included in the tunnel calculation (and which can be displayed graphically) are automatically added to the graphical view when a tbs file is opened. This allows you to switch active documents as in other graphical views and edit data.
There are three different orientation modes, these are selected by tabs at the bottom.
Under a separate tab in the graphic part of the tbs window, 3D graphics are always available. Here, the entire mass calculation is presented in a three-dimensional perspective view.
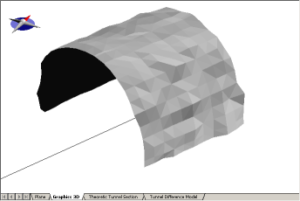
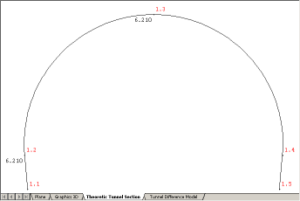
All the theoretical tunnel sections that have been entered in the tbs document are displayed graphically in this view.
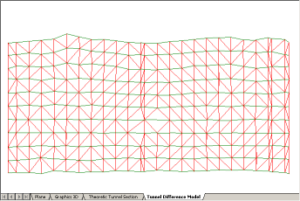
Keep in mind that the tunnel difference model is created based on the structure of the theoretical tunnel. If you change something in the tun file, the model must be re-created.
This view shows the tunnel difference models for the tunnel. The orientation mode is a plan view with a longitudinal section vertically and dimensions along the tunnel wall horizontally in the window.
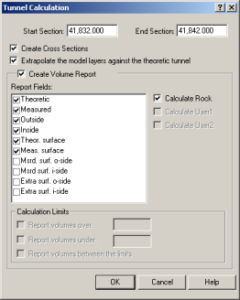
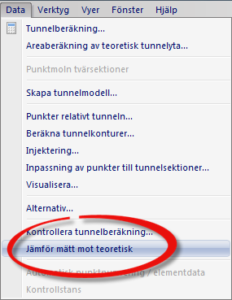
To perform a calculation of the volumes, select Data | Tunnel calculation….
A dialog shows which choices for the calculation have been made.
Here you can temporarily change the scope of the calculation by selecting sections other than those proposed.
Check if sections are to be created (for drawing / review) and if a report is to be created, and if so, what content is desired in the report. Possible report fields are theoretical and actual volume, volume inside and outside the theoretical tunnel and theoretical / actual mantle area. In addition, you can choose to have the calculation divided according to height limits. These restrictions are set by selecting Data | Settings from the tbs document. If you have chosen to use additional models (user1 and user2), you can also have these volumes / areas reported in the report.
The created section file (.sec) and the report file (.rep) are displayed when the calculation is complete.
Using the calculated tunnel section file, the .sec file, it is easy to create a tunnel section drawing.
By entering the document properties, Views | Document properties, for either a tbs document or a calculated cross-sectional file (sec) you can set different graphic parameters under the Tunnel tab.
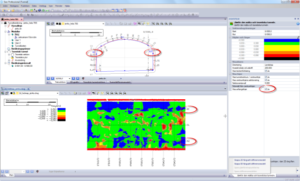
You can choose to show the perpendicular distance between the rock and the theoretical tunnel. Överberg will be marked outside the rock contour and underberg inside.
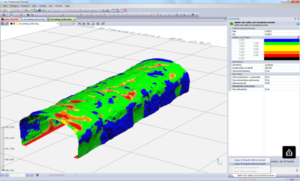
Colored tunnel difference models can be created from the tunnel calculation, and a folded tunnel difference model in 2D can be created where intrusions and overburden are reported with user-defined color scales. The corresponding 3D difference model can also be created in the same function. These models are created in AutoCad’s DWG format. We call the function “Compare measured against theoretical” and you will find it under the data menu when a tunnel calculation (* .tbs) is open and active.
If the theoretical tunnel is created in the traditional way with * tune files, start lines for the tunnel can be created automatically by encoding the start in the tune file. For this to work, the left start must be coded “A1” and the right “A2”, the tunnel center can be coded “TC” as usual, but this is only necessary if the tunnel center deviates from the calculated center line (* .l3d). If the theoretical tunnel consists instead of a dwg file, only the tunnel center is drawn.
There are also a number of other tunnel functions, e.g. area calculation of theoretical tunnel area, calculation of points in relation to the tunnel, tunnel contours and calculation of grouting holes.